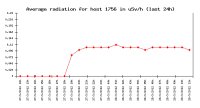
samples in µSv/h (spoken: micro Sievert per hour)
Sequence of the last 1000 samples, from the right (0 = now) to the left (-1000 from approximately 14 h ago)
|
|
||||||||||||
|
|
Diagram of the equivalent dose of the local gamma radiation |
| also: local dose rate (LDR) - | status from: - local time |
| corresponds: - UTC |
samples in µSv/h (spoken: micro Sievert per hour)
Sequence of the last 1000 samples, from the right (0 = now) to the left (-1000 from approximately 14 h ago)
|
|
||||||||||||
|
|
measurement station: |
Urb. Sitio de Calahonda, E-29649 Mijas-Costa / Málaga, Spain |
|
geogr. position: |
36°26'26.70" N, 4°43'38.71" W, height above sea level: 180 m nhn |
Second version - This page is still under construction!
Last update: 05.04.2012 21:04
|
|
|
|
|
|